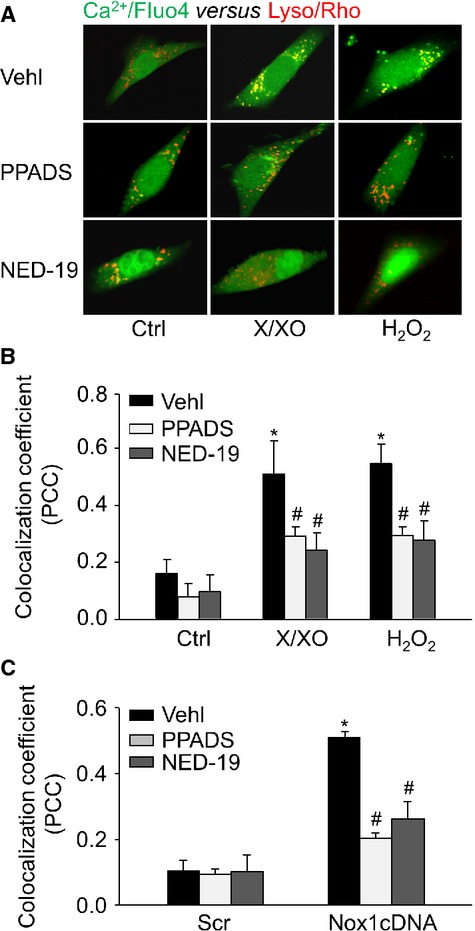
Figure 7.

Confocal microscopic detection of Ca2+ release from lysosomes locally in CAMs. (A) Representative confocal microscopy images showing Ca2+ release regions that co-localized with lysosomes as shown by yellow spots formed by green fluo-4 signals with rhodamine-red lysosomal marker (Lyso/Rho). Summarized data showing the co-localization coefficient of Ca2+/fluo-4 with Lyso/Rho signals in CAMs treated with X/XO or H2O2 (B) or Nox1 cDNA (C; n = 6 for all panels). *P < 0.05 versus Ctrl or Scramble; #P < 0.05 versus CAMs treated with X/XO or H2O2 or Nox1 cDNA transfection alone.
