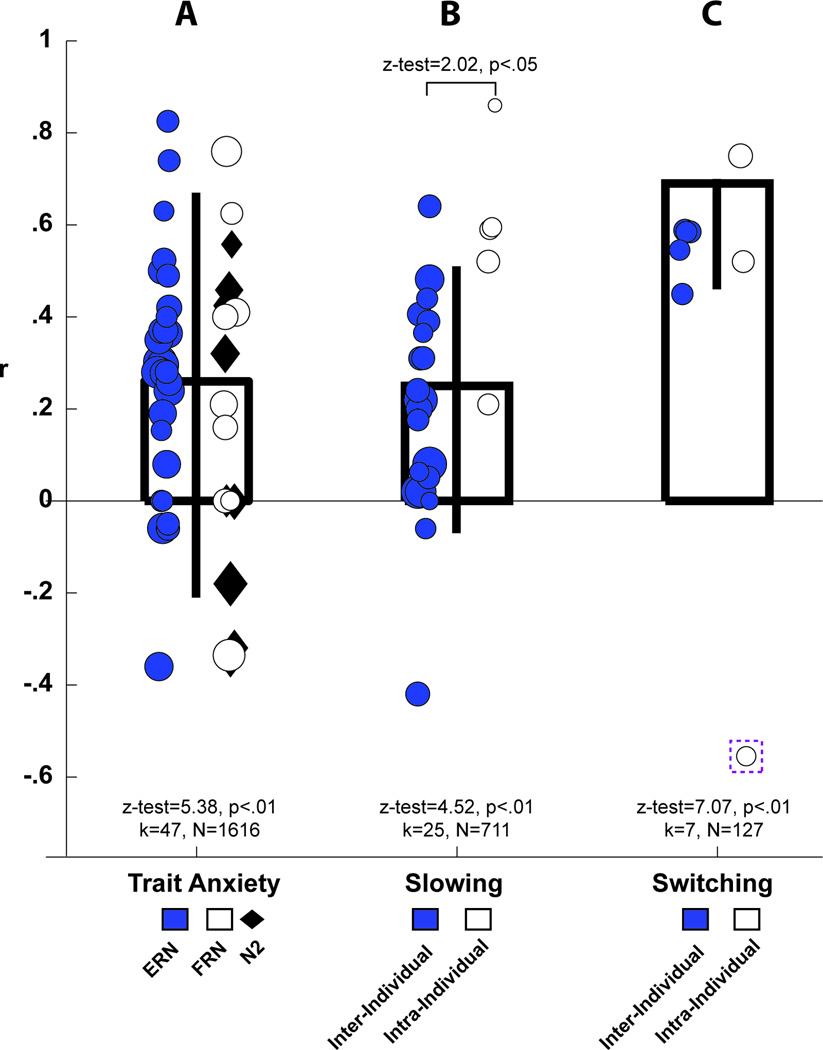
Figure 3. FMϑ is consistently related to dispositional anxiety and predicts aversively-motivated behavioral adjustments.
(A) Individuals characterized by greater dispositional anxiety show larger FMθ signals in response to conflict, punishment, and error. There was not a significant difference between response-locked error signals (filled circles) and cue-locked signals of punishment (empty circles) or conflict (filled diamonds). (B–C) Larger control signals predict a more cautious or inhibited response set following punishment or errors. (B) Larger error-related FMθ signals predict greater post-error slowing on the subsequent trial. This was observed both inter-individually (filled circles: individuals with larger error signals showed increased behavioral adjustments) and intra-individually (empty circles: trial-to-trial differences in control signals predicted proportional variation in post-error slowing) analyses. There was a significant moderating effect of this level of anlaysis, where intra-individual studies had a significantly larger relationship between error signals andresponse slowing (z-test=2.02, p<.05). (C) Larger FMθ responses to worse-than-expected feedback predict an increased probability of switching to the alternative among studies employing both inter-individual (filled circles) and intra-individual (empty circles) analytic strategies. The empty circle outlined by a dashed box indicates a study where feedback must be integrated over time and rapid switching would be maladaptive, this study was excluded a priori from this meta anlaysis on these grounds. Statistics were determined using random-effects meta-analyses (k: number of studies; n: number of participants). Error bars depict the random-effects estimate of the brain-behavior correlations (±95% CI). Each circle is centered on the correlation of each study, with the size of the circle scaled by the sample size (10*log10(N)). Larger numbers indicate a larger absolute relationship (i.e. the sign of the voltage potential is not taken into account).

