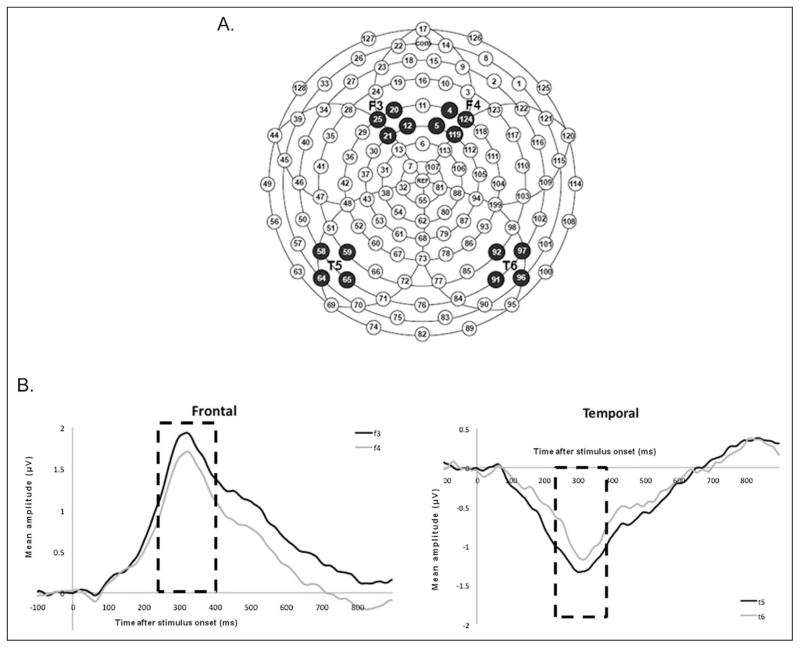
Figure 1.
Event-potential responses to speech sounds. (A) Electrode clusters on scalp locations. (B) Event-potential responses averaged across all study subjects. Mean amplitudes (in μV) averaged for all 57 patients in the 250- to 400-ms time window were: F3 = 1.48 (±0.19), F4 = 1.31 (±0.19), T5 = −1.1 (±0.11), T6 = −0.5 (±0.11). F3, frontal left; F4, frontal right; T5, temporal left; T6, temporal right.

