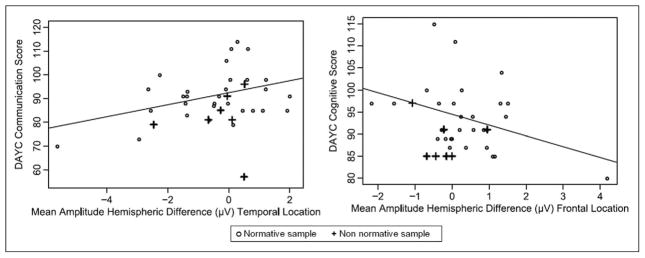
Figure 3.

Associations of hemisphere difference in amplitudes and 6-month developmental scores. Normative sample n = 50; nonnormative sample n = 7 (4 infants with severe white matter injury [grade III or IV intraventricular hemorrhage], 1 infant with Turner syndrome, 2 with unilateral auditory neuropathy). Line represents linear regression fit. DAYC, Developmental Assessment of Young Children.
