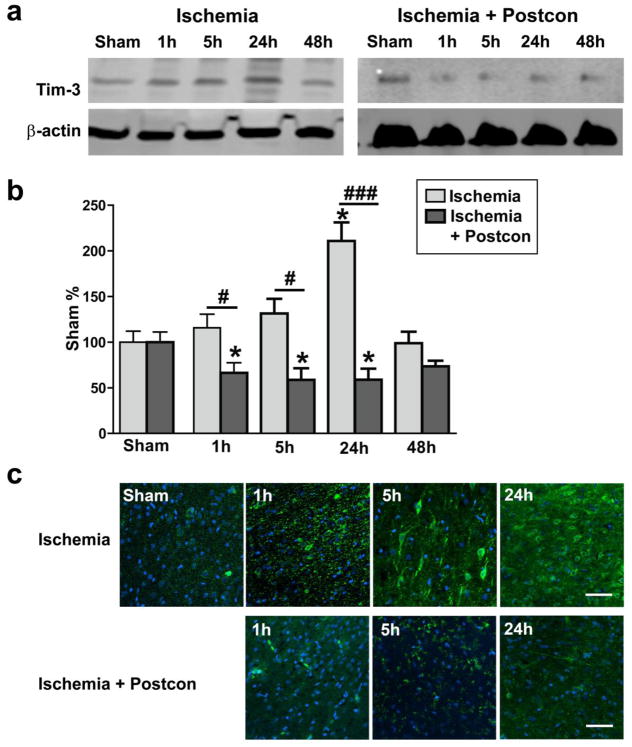
Fig. 2. Increased Tim-3 expression after stroke was inhibited by postconditioning.
Representative protein bands of Tim-3 and beta-actin are presented for rats receiving control ischemia alone (A) and ischemia plus postconditioning (D). Bar graph indicating that Tim-3 increased as early as 1h after stroke, peaked at 24h after stroke (B) and was inhibited by postconditioning (E). *, ***, vs sham, P < 0.05, 0.001, respectively, vs sham. #, ###, P < 0.05, 0.001, respectively, between the two indicated groups. N = 6/group. These results were further confirmed by immunofluorescent confocal microscopy in control ischemic (C) and postconditioning rats (F). Scale bar, 50 μm.

