
Figure 2.
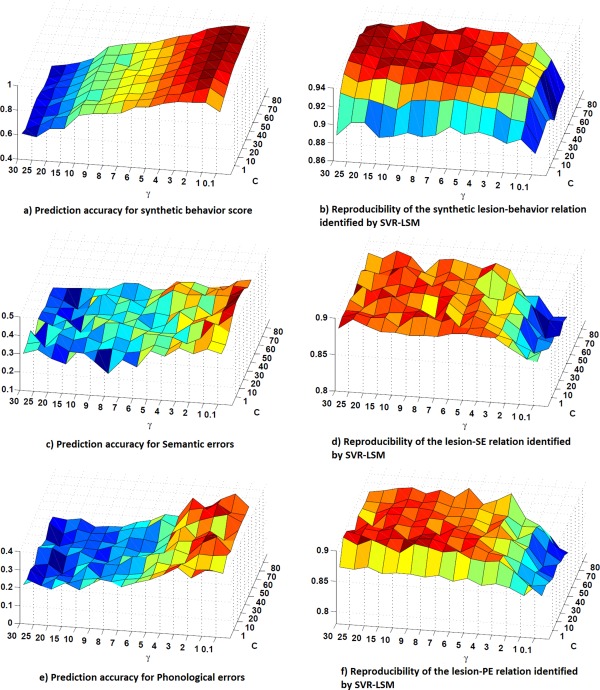
SVR parameter evaluation results. a, c, and e: are the cross‐validation prediction accuracy for synthetic score, SE‐ and PE versus lesion association analysis, respectively; b, d, and f: show the reproducibility of the SVR‐LSM β‐map for the three datasets, respectively. [Color figure can be viewed in the online issue, which is available at http://wileyonlinelibrary.com.]