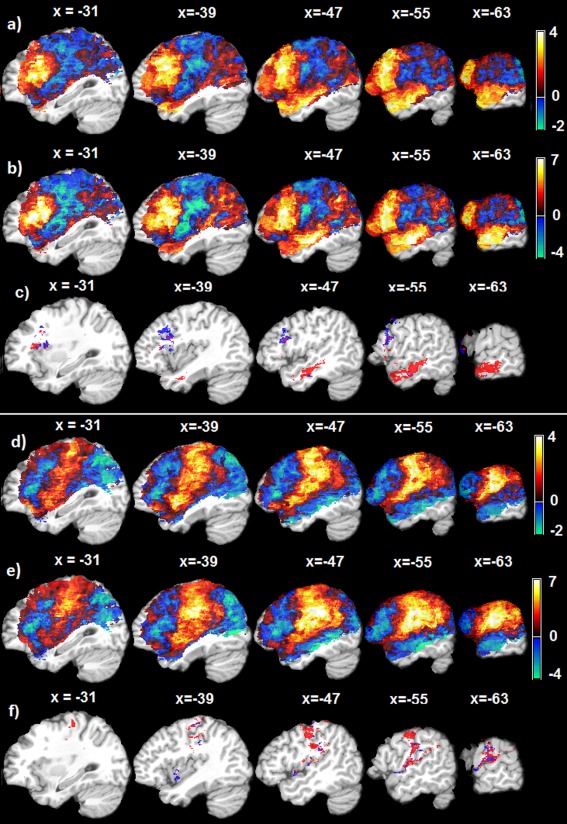
Figure 6.

Lesion‐symptom relation mapping results using 106 Aphasia patients' data, both VLSM and SVR‐LSM implements include dTLVC to control the effect of total lesion volume. a–c: are for lesion‐SE relations, and d–f are for lesion‐PE relations. a: The non‐thresholded VLSM t‐map; b: the non‐thresholded SVR‐LSM map; c: thresholded (p ≤0.001, cluster size > 50) permutation probability maps of the lesion‐SE relations detected by VLSM (blue color) and SVR‐LSM (red color); d: The non‐thresholded VLSM t‐map; e: The non‐thresholded SVR‐LSM map; f: thresholded (p≤0.001, cluster size > 50) permutation probability maps of the lesion‐PE associations detected by VLSM (blue color) and SVR‐LSM (red color). The text above each slice indicates the spatial location of the sagittal slice in the MNI space. [Color figure can be viewed in the online issue, which is available at http://wileyonlinelibrary.com.]
