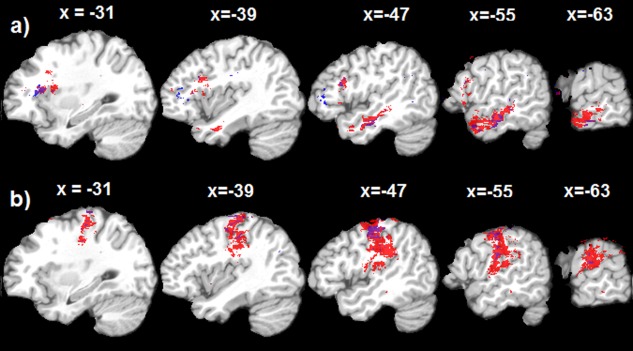
Figure 7.

Thresholded (p , cluster size > 50) permutation probability maps of the nonlinear SVR‐LSM (Red) and linear SVR‐LSM (Blue). a: results for SE‐lesion relations, b: results for PE‐lesion relations. The text above each slice indicates the spatial location of the sagittal slice in the MNI space. [Color figure can be viewed in the online issue, which is available at http://wileyonlinelibrary.com.]
