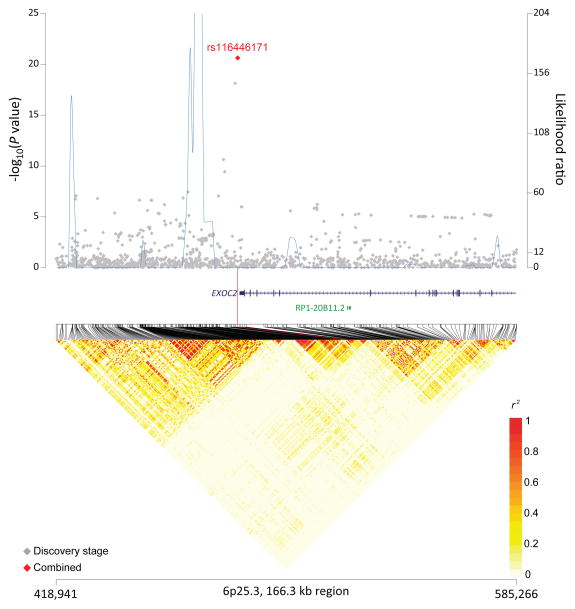
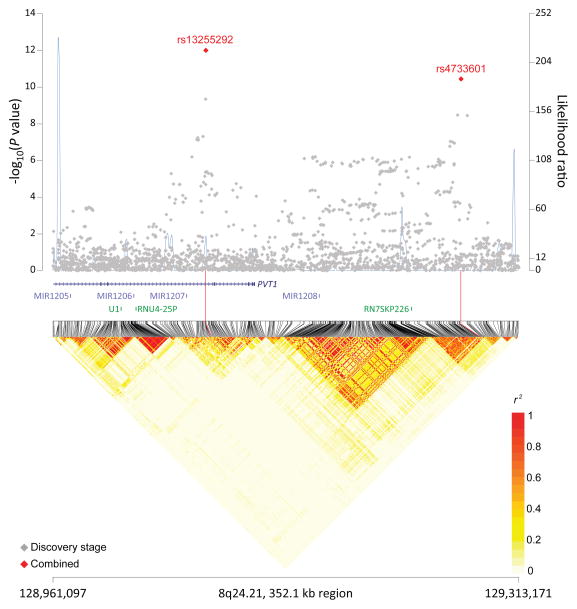
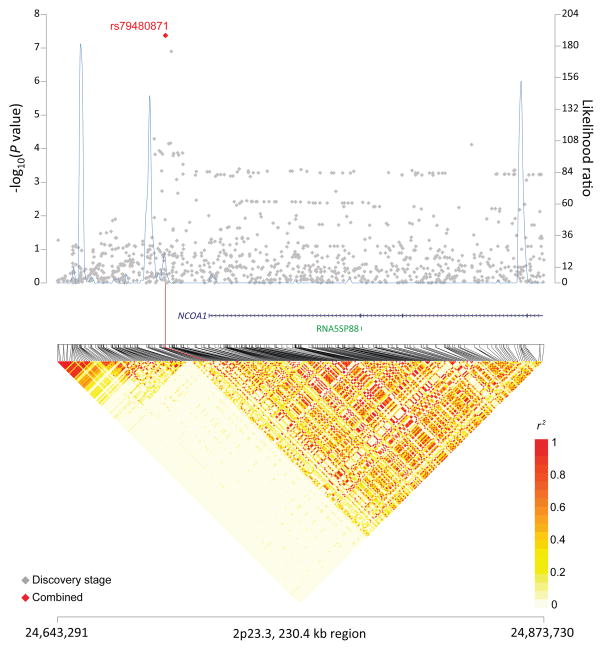
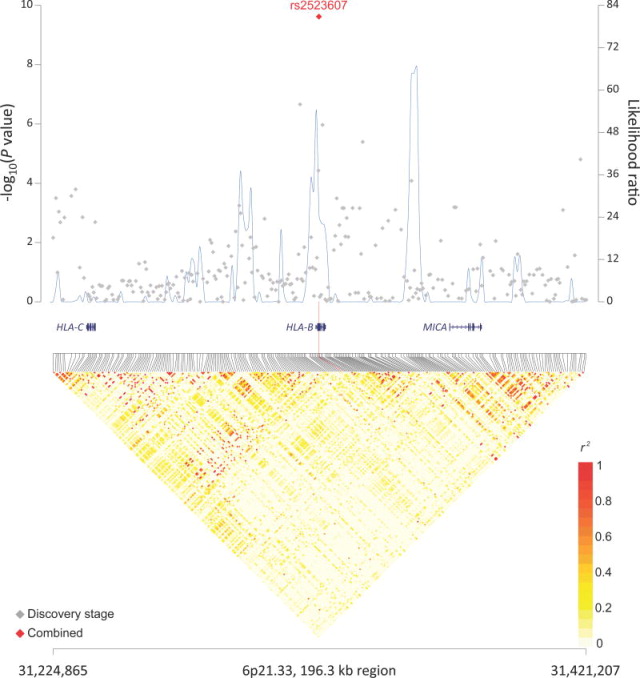
Figure 1. Association results, recombination hot-spots, and linkage disequilibrium (LD) plots for the regions newly associated with diffuse large B-cell lymphoma (DLBCL).
(a–d) Top, association results of GWAS data from stage 1 DLBCL-GWAS (grey diamonds) and combined data of stages 1–3 (red diamond) are shown in the top panels with −log10(P) values (left y axis). Overlaid are the likelihood ratio statistics (right y axis) to estimate putative recombination hotspots across the region on the basis of 5 unique sets of 100 randomly selected control samples. Bottom, LD heatmap based on r2values from combined control populations for all SNPs included in the GWAS. Shown are results for 6p25.3 (a), 8q24.21 (b), 2p23.36 (c), and p21.33 (d) regions.


