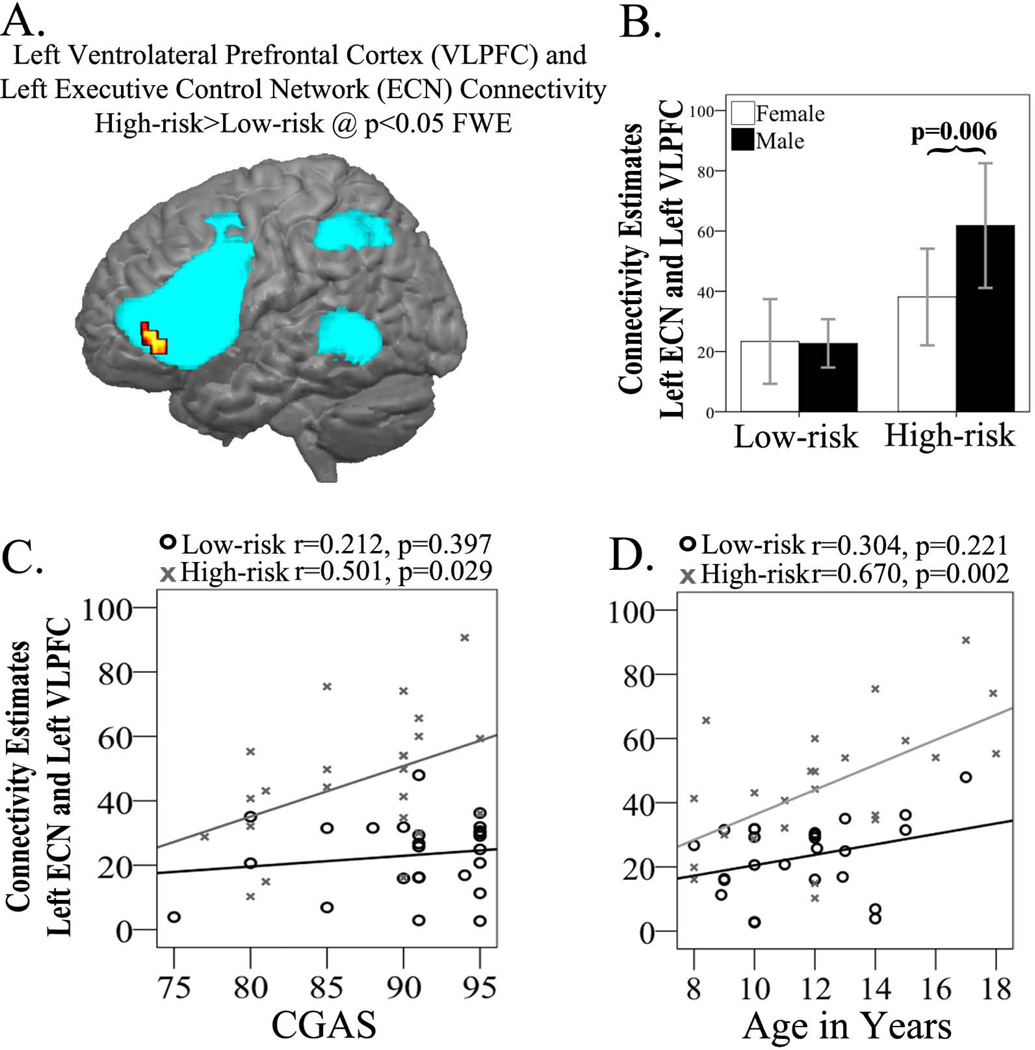
Fig. 2.
Group independent components analysis (ICA) results in the high-risk and low-risk groups. (A) Left ventrolateral prefrontal cortex (VLPFC) cluster showing high-risk > low-risk connectivity differences overlaid upon the left executive control network. (B) Extracted connectivity measures from the left VLPFC show high-risk males with increased connectivity (p = 0.006) compared to high-risk females. (C) Positive correlation (r = 0.501, p = 0.029) in the high-risk group between VLPFC connectivity estimates and Clinical Global Assessment Scale (CGAS) scores. (D) Positive correlation (r = 0.670, p = 0.002) in the high-risk group between VLPFC connectivity estimates and age. ECN = executive control network; FEW = family-wise error.

