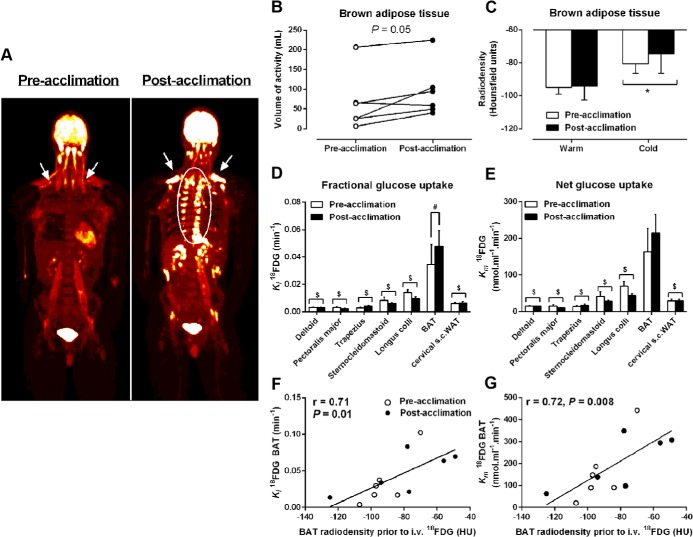
Figure 3.
Tissue glucose uptake. A, Coronal view (anterior-posterior projection) of whole-body 18FDG uptake during cold exposure before and after acclimation. B, Volume of BAT 18FDG activity before and after acclimation. C, BAT radiodensity by CT during room temperature and cold exposure before and after acclimation. D and E, Fractional (Ki) (D) and net (Km) (E) glucose uptake in cervicothoracic tissues. F and G, Relationship between BAT radiodensity from CT taken before iv 18FDG injection in the cold and Ki 18FDG (Pearson r = 0.71, P = .01) (F) and Km 18FDG (Pearson r = 0.72, P = .008) (G). *, P < .05 vs room temperature; $, P < .005 vs BAT; #, P < .05 vs before acclimation, ANOVA with Bonferroni's post hoc test.

