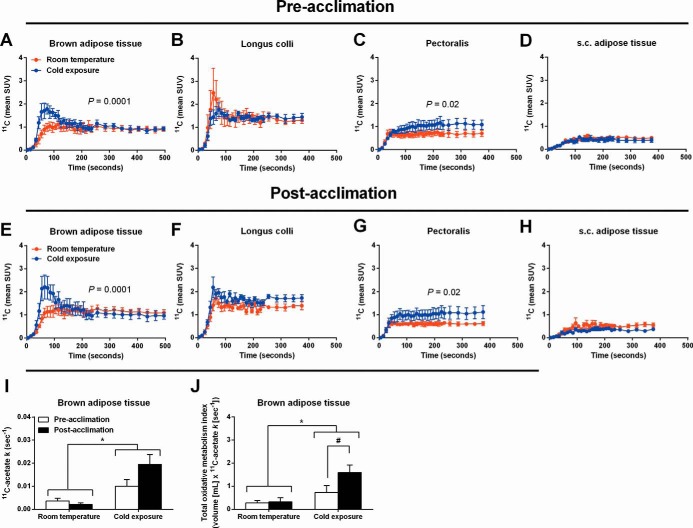
Figure 4.
[11C]Acetate kinetics. A–H, 11C time-radioactivity curves over the first 500 seconds of acquisition after [11C]acetate injection at room temperature (red) and during cold exposure (blue) in BAT (A and E), longus colli (B and F), pectoralis (C and G), and cervical sc white adipose tissue (D and H) before and after acclimation. I, Tissue oxidative metabolism index ([11C]acetate k) in cervicothoracic BAT before and after acclimation. J, Total BAT oxidative metabolism index before and after acclimation. *, P < .05 vs room temperature; #, P < .05 vs before acclimation, ANOVA with Bonferroni's post hoc test.

