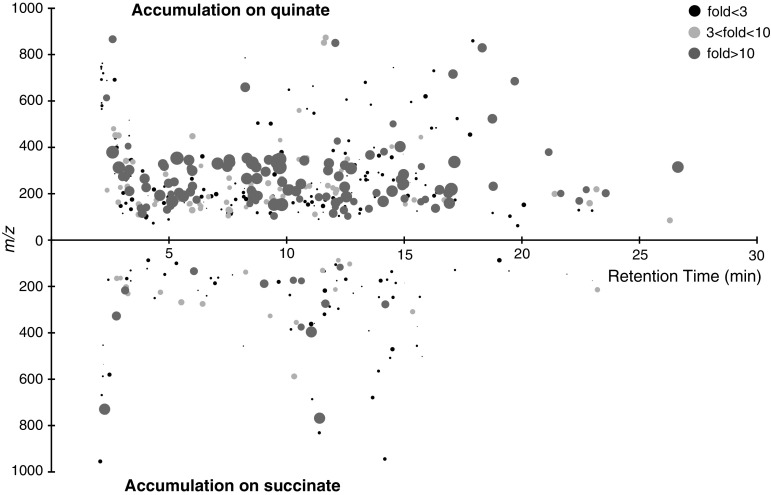
Fig. 3.
Visualization of the 451 LC/MS-detected metabolites of A. baylyi ADP1. The retention time on the ZIC-pHILIC column is represented by position on the x-axis. Mass-to-charge ratio is represented by position on the y-axis. Fold change is indicated by color and radius of each metabolite (log scale). Upper panels metabolites accumulating in quinate-grown cells. Lower panels metabolites accumulating in succinate-grown cells

