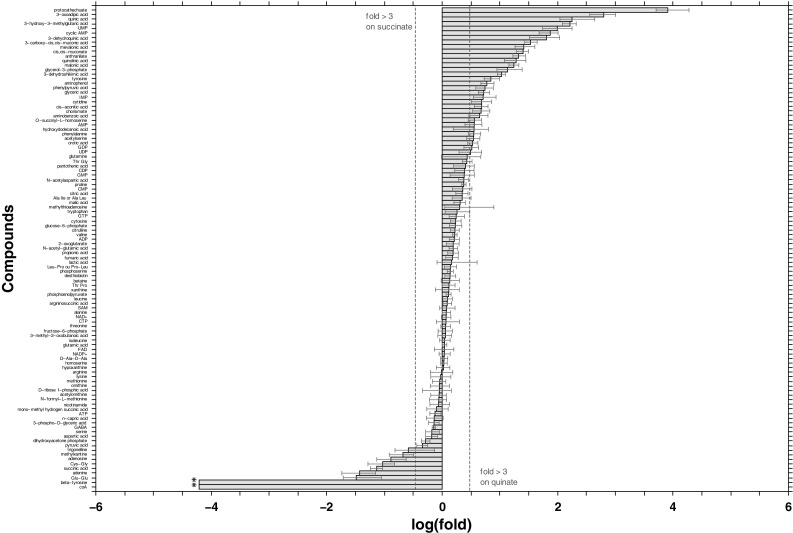
Fig. 4.

Differences for identified metabolites in ADP1 metabolomes. Alterations are expressed as log(fold). The confidence intervals of log(fold) at 95 % (red whiskers) were determined using Fieller’s formula (Fieller 1954) derived from the t test for the ratio of two means with unequal variances (Tamhane and Logan 2004). Data represent the average for 6 independent succinate metabolomes and 4 quinate metabolomes. Dotted blue lines correspond to a fold-change of 3. Asterisk indicates metabolites for which the fold-change is infinite (absence in quinate-grown cells) (Color figure online)
