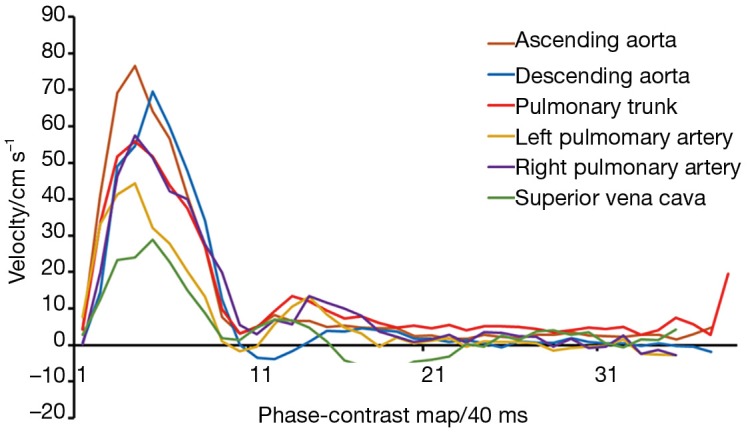
Figure 13.

Real-time phase-contrast flow MRI (3 T, 40 ms) of major heart vessels for a single cardiac cycle (same subject as in Figure 11). The curves represent mean blood flow velocities averaged across the respective vessel lumen for the ascending and descending aorta, pulmonary trunk, left and right pulmonary artery, and superior vena cava. MRI, magnetic resonance imaging.
