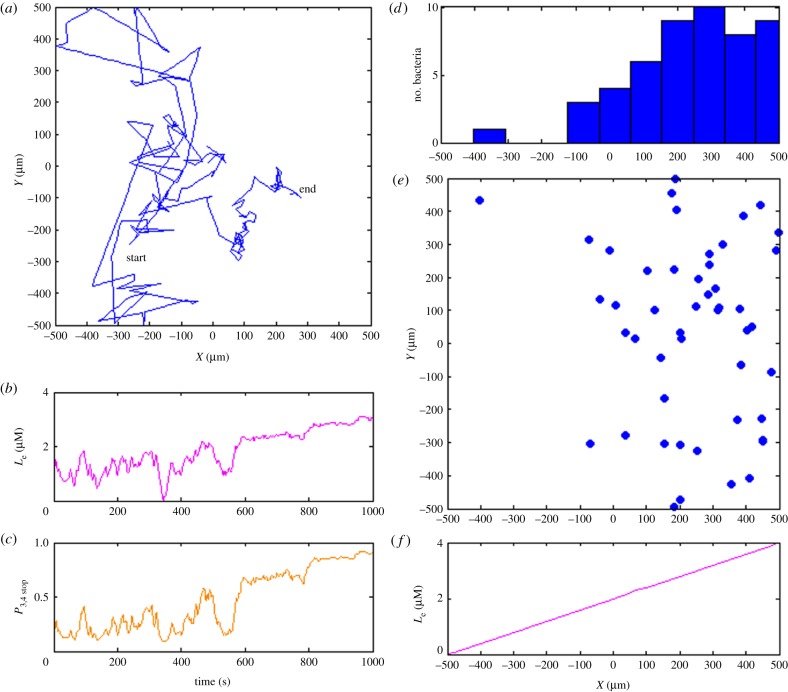
Figure 3.
Simulation of transmembrane cluster-mediated chemotaxis. (a) Trajectory of exemplar bacterium showing movement up the gradient from left to right in the simulation box. (b) Experienced local ligand concentration of simulated bacterium during 1000 s simulation period. (c) Stopping probability based only on the transmembrane sensory pathway. (d) The distribution of 50 independently bacteria along x-axis after 1000 s simulation time. (e) The final distribution of 50 simulated in silico bacteria. Almost all the simulated bacteria migrate to the area where external ligand is abundant. (f) The external ligand concentration increases linearly in x-direction from −500 to 500 µm. (Online version in colour.)

