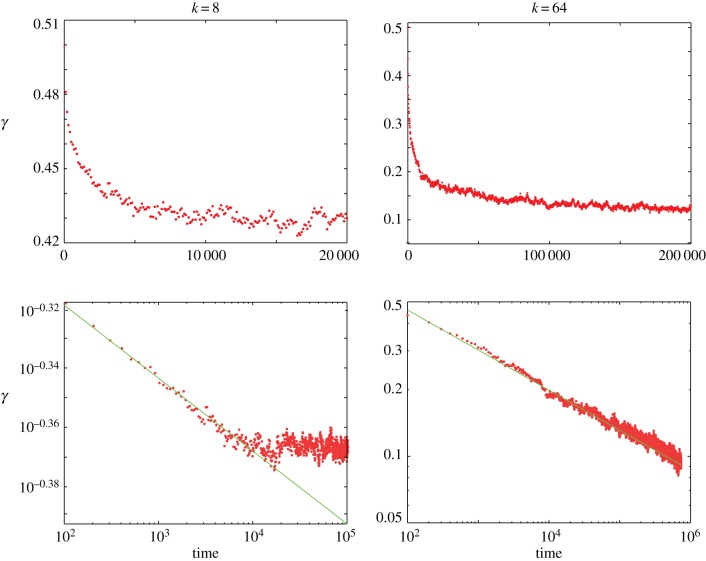
Figure 3.
Development of the interface index γ as a function of time for k = 8 and 64. The results are the average of 10 simulations and are shown on linear and log–log scales. For high k, a more pronounced segregation is observed. The interface index is seen to decrease according to a power law until it saturates at an equilibrium value. The exponent increases with increasing k, and takes the values 0.025 for k = 8 and 0.17 for k = 64. (Online version in colour.)

