
Figure 2.
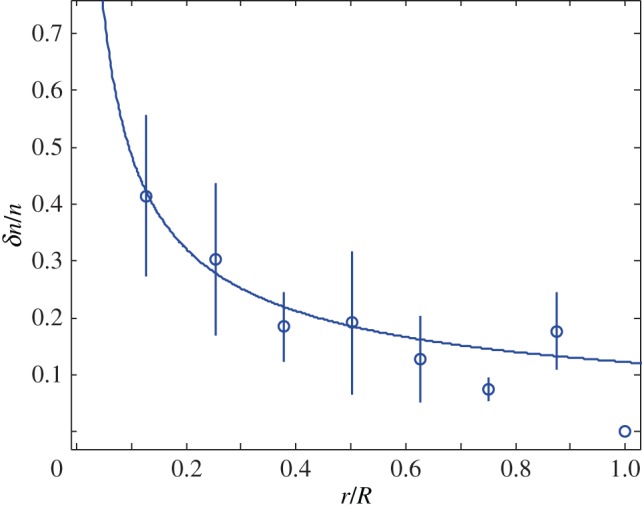
Relative cell density increase δn/n = (n0 − n(5 min))/n0 of HT29 cells 5 min after an external pressure jump as a function of radial distance r normalized by spheroid radius R (circles). Here n0(r) denotes the cell density at radius r before the pressure jump. Data as shown in figure 1a. Fit of 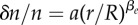 to the experimental data, corresponding to the theory given by equation (4.13) (solid line). Fit parameters
 and fit quality χ2 = 0.73. (Online version in colour.)