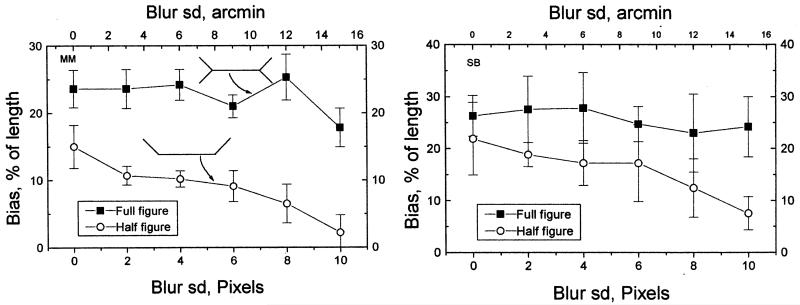
Fig. 10.
Effects of blur on the perceived extent of the outgoing-fins version of the Muller–Lyer figure (full figure: squares) and the half-figure (circles) in which the fins were present on one side of the line only. The icons in the left-hand panel illustrate these two configurations. The two panels are for different subjects (SB and MM). The data are means over three independent settings; error bars are standard deviations of these settings. Both subjects show a decrease in the bias in the half-figure as the extent of blur increases. The behaviour is similar to that of the obtuse-angle Poggendorff figure.

