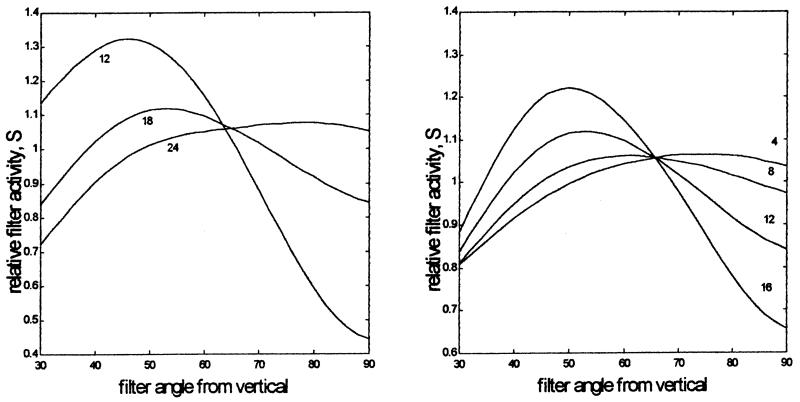
Fig. 15.
The two panels show the results of simulations of the Poggendorff bias described in Fig. 3 and in the Appendix. The quantity computed (vertical axis) is the response of each of a set of oriented Gabor filters (orientation on the horizontal axis) placed with their centre mid-way along the virtual line joining the two traversals of the Poggendorff figure (see Fig. 3). Since the true angle of the traversals and of the virtual line is 45°, the maximum response would be expected in a filter oriented at 45°. However, the distribution is distorted by a prior stage of isotropic filtering (see Fig. 3). In the first simulation (left hand panel) σx of the isotropic Gaussian filter was eight pixels and the size of the oriented Gabor envelope was varied. In the second simulation, (right hand panel) σx of the isotropic Gaussian filter was varied with σx of the oriented Gabor held constant at 18 pixels. The gap between the parallels was 24 pixels.

