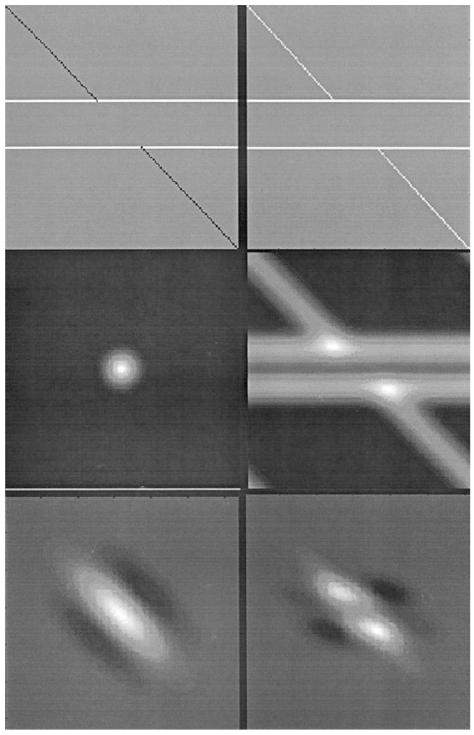
Fig. 3.
The images illustrate the stages of processing in the proposed model of the Poggendorff illusion. We begin with a version of the Poggendorff figure in which the obliques and parallels are of opposite contrast, since later experiments will show that the classical effect is still seen in this configuration. In the first stage (top row, right hand panel) the image is subjected to a pointwise rectification. In Stage II (second row of the figure) the rectified image is subjected to an isotropic Gaussian filter (filter: left, filtered figure: right). In Stage III (bottom row) the response of an oriented DoG filter in the centre of the image is measured by pointwise multiplication of the filter (left hand panel) and the output of Stage II. To obtain the response of the filter the pointwise-multiplied image (right-hand panel) is integrated. Stage III is repeated over a bank of oriented filters to obtain the filter response as a function of filter orientation. The population response is then used to compute the orientation of the virtual line in the Poggendorff figure (see Appendix A).

