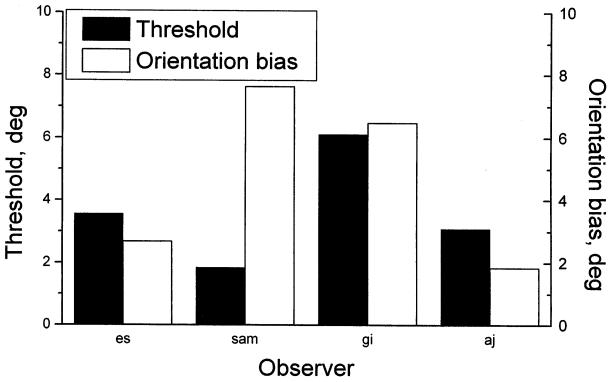
Fig. 4.
Results of Experiment 1, to determine the threshold (jnd) and bias in a Poggendorff figure from psychometric functions rather than the method of adjustment. The figure panel shows thresholds and biases for four observers separately, using a traditional Poggendorff figure. The units are in degrees of orientation of the virtual line joining the two intersection points in the figure, not degrees of visual angle. For further details see the text.

