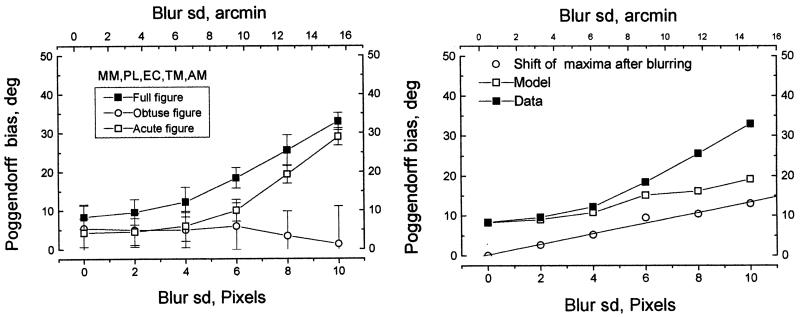
Fig. 9.
The figure shows the actual and predicted effects of blurring upon the bias in the Poggendorff effect. The angular Poggendorff bias is calculated from the linear extent of the illusion by calculating the angle of the virtual line joining the two intersections in the figure when it appears to be aligned. The difference between this calculated angle and the unbiased value of 45° is the angular measure of the Poggendorff effect. The left-hand panel shows the measured effect of low-pass (Gaussian) blur upon the full Poggendorff figure, the acute angle version and the obtuse angle version (see Fig. 1 for illustration of these figures). The horizontal axis shows the standard deviation of the Gaussian filter with which the figures were convolved; the vertical axis shows the mean measured bias in five observers. The error bars are 95% confidence intervals, based on the variance between, not within, observers. The right hand panel shows the fit to the data of the model described in the text. The lowest curve (circles) shows the shift in the angle of the virtual line joining the two maxima in the convolved image, corresponding to the area enclosed by the acute angle. The filled squares represent the data; the open squares show the predictions of the model based on intrinsic Gaussian blur of 6 arc min.

