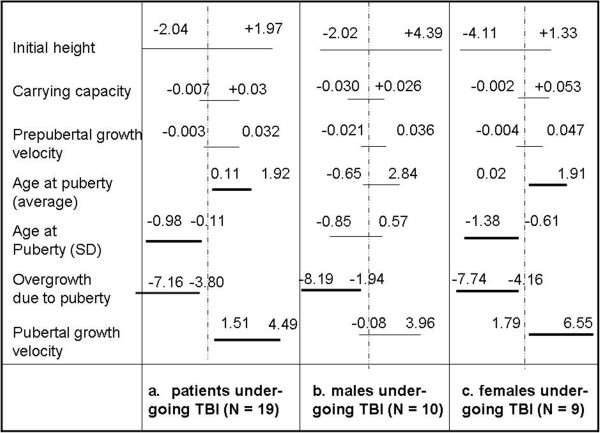
Figure 2.

Plot of the 95% Confidence Interval of the variable Δ = value estimated by the model on the sample - value estimated by the model on the 50 th centile of appropriate HGC for all the model parameters. The considered samples are the total of the patients undergoing TBI but not GH therapy (a), the subsample formed by the males (b) and by the females (c).
