
Figure 2.
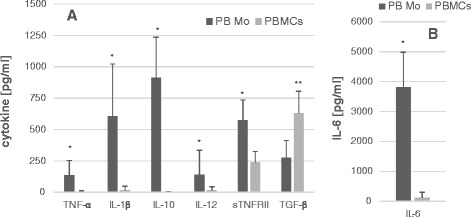
Comparison of production of cytokines (TNF-α, IL-1β, IL-10, IL-12p40, sTNRII, and TGF-β) (Panel A) and IL-6 (Panel B) by purified peripheral blood monocytes (PB Mo) (0.25 × 10 6 cells/ml) and peripheral blood mononuclear cells (PBMCs) (10 6 cells/ml) from the same blood samples of randomly selected subjects from all the study groups (N = 21). Each data point was shown as a mean cytokine level ± SD. The concentration of PB Mo and PBMC monocytes in culture were set to be approximately the same. *; P <0.001, **; P <0.005 (Wilcoxon rank sum test).