
Figure 4.
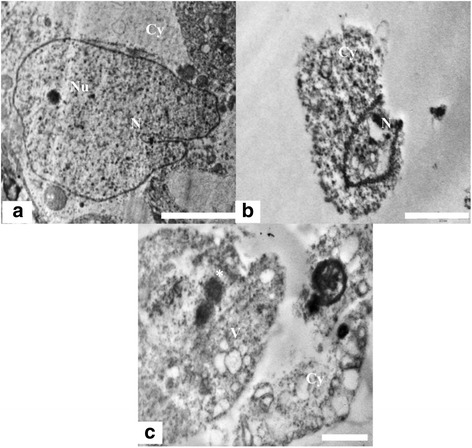
TEM micrograph of Sertoli cell nucleus and Cytoplasm. (a) Testis ultra structure of the control animals showing the sertoli cell nucleus (N) and cytoplasm (Cy). The nucleus shows indentation and a prominent nucleolus (Nu). Scale bar =2 μm, (b) The animals in experimental group 2 showing apoptotic Sertoli cell nucleus. Scale bar =2 μm and (c) Ultra structure of highly vacuolated (V) and degenerated sertoli cell having electron dense bodies (*).Scale bar =2 μm.