
Figure 5.
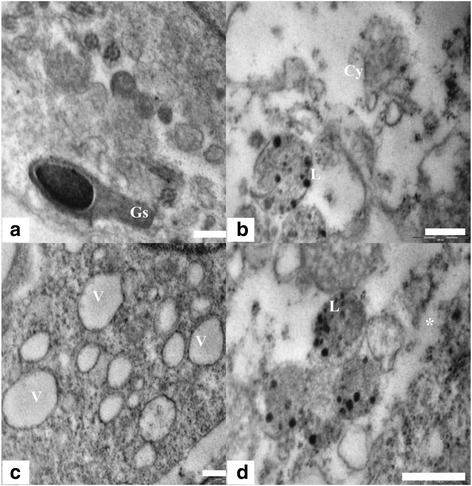
TEM micrograph of Sertoli cell, lysosome and Cytoplasm. (a) Sertoli cell cytoplasm of control group 1 showing healthy cytoplasm having intact germ cells (Gs) and intact granular cytoplasm (Cy). Scale bar =0.5 μm, (b) Sertoli cell ultra structure showing degenerated cytoplasm (Cy) and lysosome bound nanoparticles (L). Scale bar =0.5 μm, (c) Highly vacuolated (V) sertoli cell cytoplasm in nanoparticle treated group. Scale bar =0.5 μm and (d) Sertoli cell cytoplasm in treated group 2 showing accumulation (*) of nanoparticles and liposomes containing nanoparticles (L). Scale bar =0.5 μm.