
Figure 9.
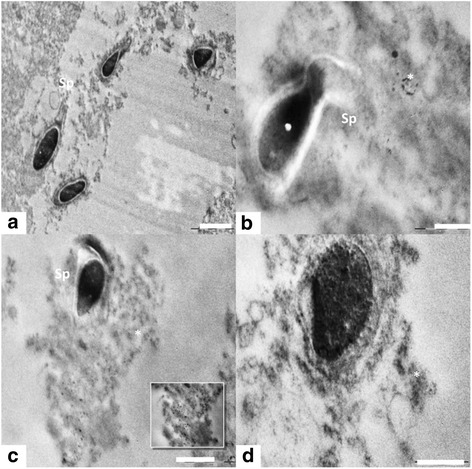
TEM of spermatogenesis. (a) Normal spermatogenesis showing healthy round and elongating spermatids (Sp) in control group. Scale bar =2 μm, (b) Abnormally developed spermatid (Sp) engulfed by sertoli cell cytoplasm and nanoparticle accumulation (*) in experimental group. Scale bar =0.5 & 1 μm, (c) Abnormally developed spermatid (Sp) engulfed by sertoli cell cytoplasm and nanoparticle accumulation (*) in experimental group. Scale bar =0.5 & 1 μm and (d) Deposition of nanoparticle on acrosomal membrane and sertoli cell cytoplasm. Scale bar =0.5 μm.