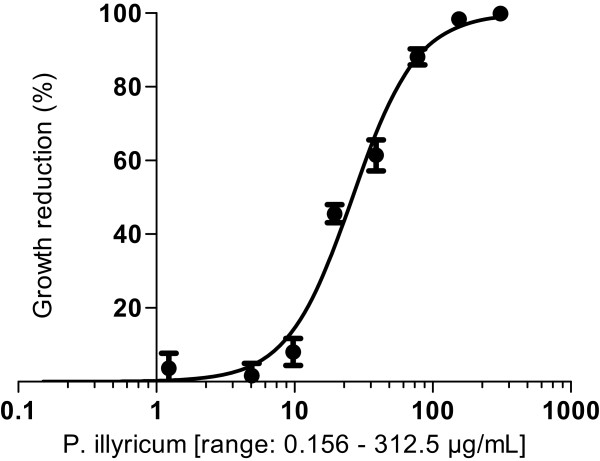
Figure 1.

Representative dose–response curve of a Candida albicans clinical isolate. Experimental IC50 values were obtained by the interpolation of data on the specific dose–response curve, generated by means of a nonlinear regression analysis. In particular, the reduction of the yeast growth, expressed as percentage, was plotted against the drug concentration, in logarithm scale, leading to the generation of a sigmoidal curve following the equation Y = 100/(1 + 10^((LogIC50-X)*HillSlope))), where Y =50.
