
Figure 7.
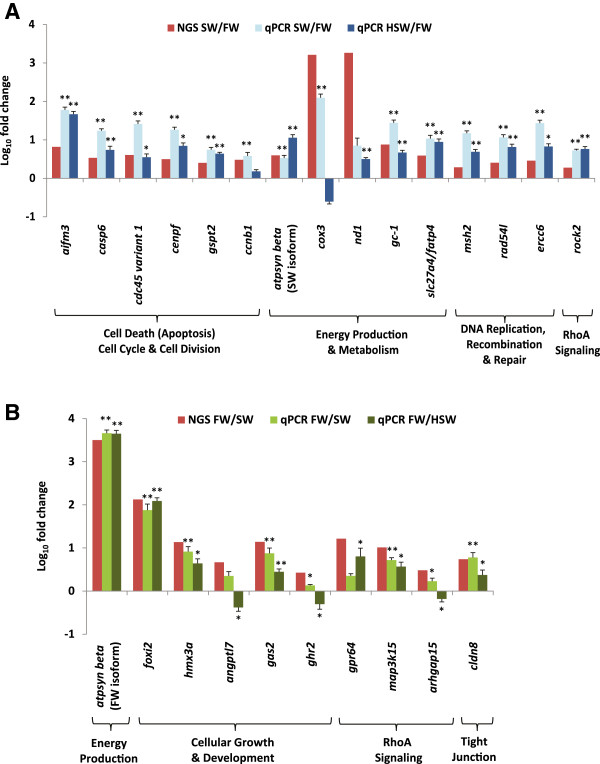
NGS data and quantitative real-time PCR of representative genes associated with canonical signaling pathways or biological functions that were identified as differentially expressed i.e. (A) abundant in freshwater (FW) gill or (B) abundant in seawater (SW) gill of Oreochromis mossambicus . Data that assume normality and homogeneity of variance were subjected to ANOVA followed by Tukey-Kramer post-hoc test. Data that do not assume normality or homogeneity of variance were subjected to Kruskal Wallis followed by Mann–Whitney U test and Bonferonni correction for multiple comparisons. **indicates P-value < 0.01 while *indicates P-value < 0.05 when SW and HSW are compared to FW for the same gene. N = 6–7 replicates.