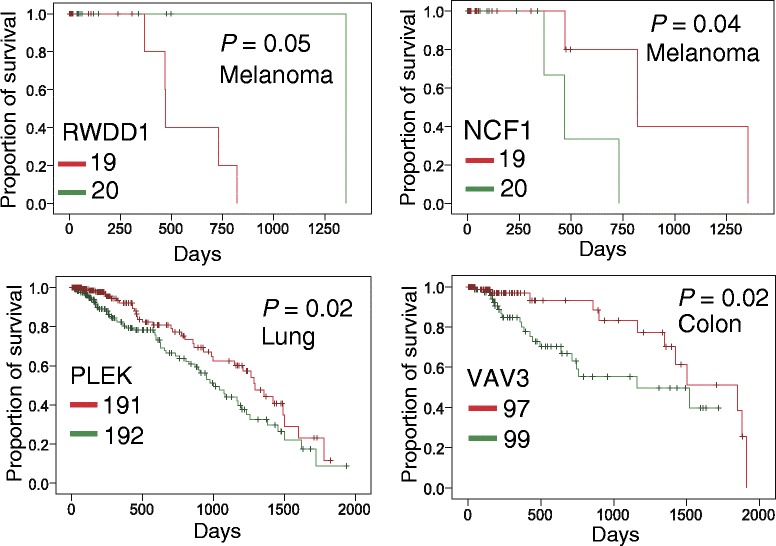
Figure 5.

Kaplan-Meier survival curves for four putative cancer genes identified by the statistical framework. Patients were grouped into lowly (green) and highly (red) expressed groups based on the median expression levels of genes in skin cutaneous melanoma (melanoma), lung adenocarcinoma (lung), and colon adenocarcinoma (colon). The P values were performed using Mantel-Cox Log Rank test.
