
Figure 6.
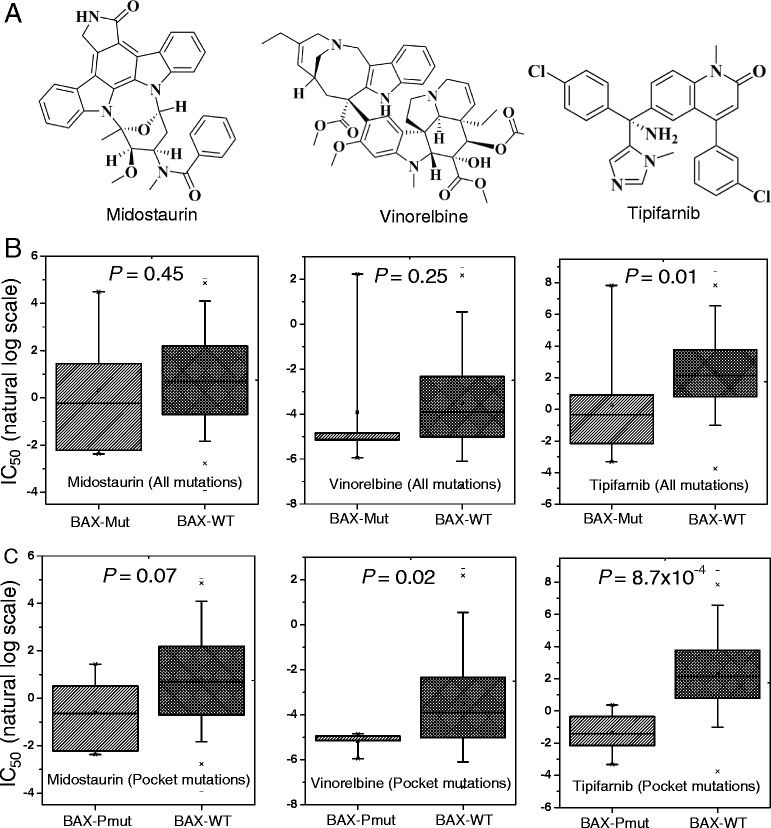
Anticancer drug sensitivity analysis. (A) The two-dimensional chemical structures of three anticancer drugs: midostaurin, vinorelbine, and tipifarnib. (B) The distribution of the half maximal inhibitory concentration (IC50, natural log scale) values for BAX gene-mutated cancer cell lines (BAX-mut) versus BAX gene wild-type cancer cell lines (BAX-WT) using all of the BAX gene’s mutation profiles. (C) The distribution of (IC50, natural log scale) values for BAX pocket mutated cancer cell lines (BAX-Pmut) versus BAX wild-type cancer cell lines (BAX-WT) using BAX protein pocket mutations only. The P values were calculated by the Wilcoxon test.