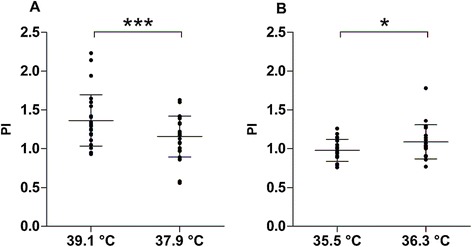
Figure 2.

Data are presented as mean ± standard deviation; every dot represents the value of the considered parameter in one artery. (A) Mean difference in pulsatility index (PI) between the two time points in the defervescence group: during fever (mean core temperature 39.1°C) and after defervescence (mean core temperature 37.9°C) (14 patients). (B) Mean difference in PI between the two time points in the re-warming group: before (mean core temperature 35.5°C) and after re-warming (mean core temperature 36.3°C) (12 patients). Paired t-test. *P <0.05, ***P <0.001.
