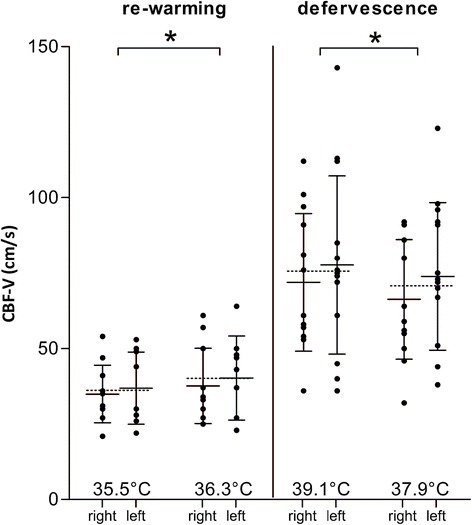
Figure 3.

General linear model for repeated measures. Data are presented as mean ± standard deviation; every dot represents the value of the considered parameter in one artery. On the left, results for the re-warming group (12 patients); on the right, results for the defervescence group (14 patients). Mean cerebral blood flow velocity (CBF-V) is presented in separate columns, for insonation of the right and left middle cerebral artery. The dotted lines indicate the mean for each pair of columns. Temperature changes had an effect on CBF-V (P = 0.01). Insonation side and method used to modify temperature (defervescence or re-warming) did not significantly affect mean CBF-V changes.
