
Figure 1. Adjusted Hazard Ratios (AHRs) for Vascular Events by Increasing Strata of TG/HDL-C Ratio.
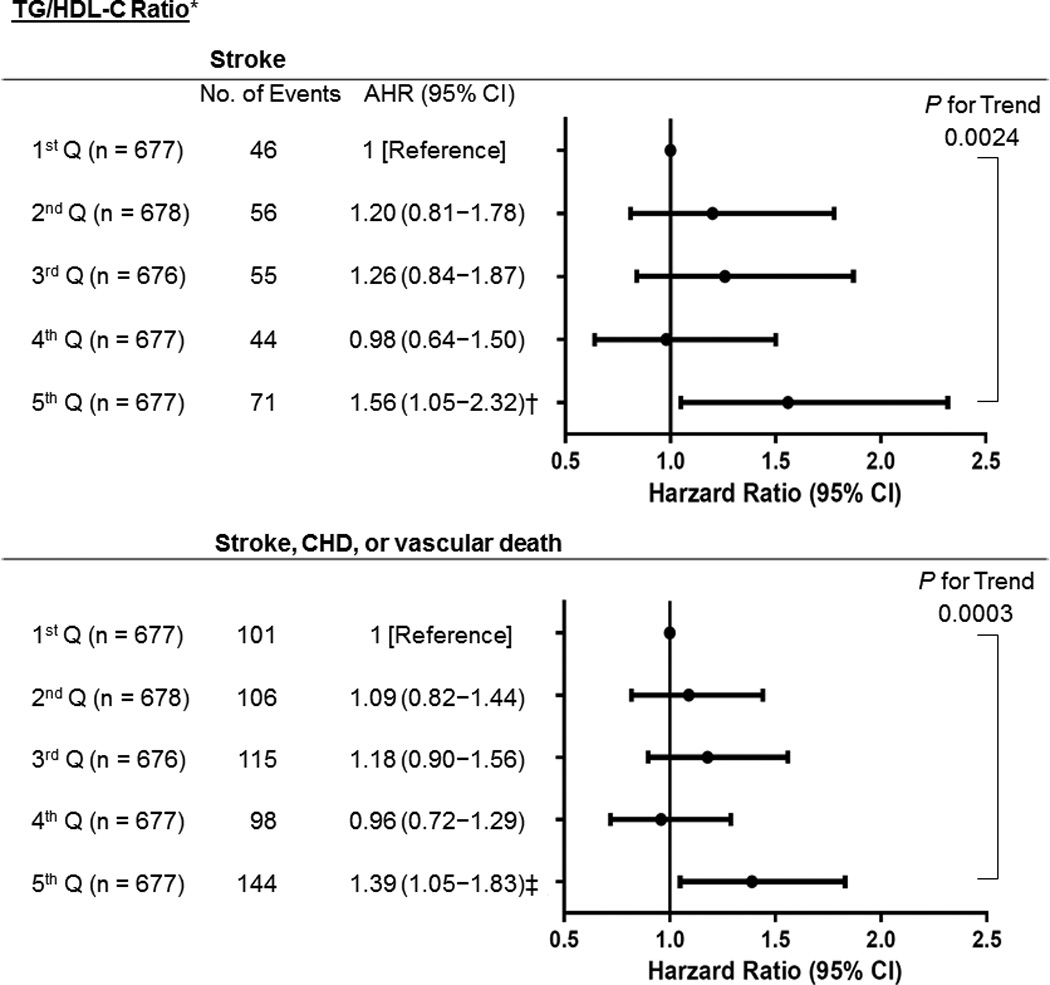
Ranges for TG/HDL-C quintile (Q) were 1st; ≤1.93, 2nd; 1.94–2.86, 3rd; 2.87–4.05, 4th; 4.06−6.21, and 5th: ≥6.22. *Adjusted for age, sex, ethnicity (white vs. non-white), body mass index, hypertension, diabetes, LDL-C, smoking, prior stroke history (before index stroke), any cardiac disease (history of myocardial infarction, congestive heart failure, coronary angioplasty, or coronary artery bypass graft surgery), antihypertensive use, and lipid modifier use. † P=0.028 (vs 1st Q). ‡ P=0.021 (vs 1st Q). TG indicates triglycerides; HDL-C, high-density lipoprotein cholesterol; LDL-C, low-density lipoprotein cholesterol; CHD, coronary heart disease.