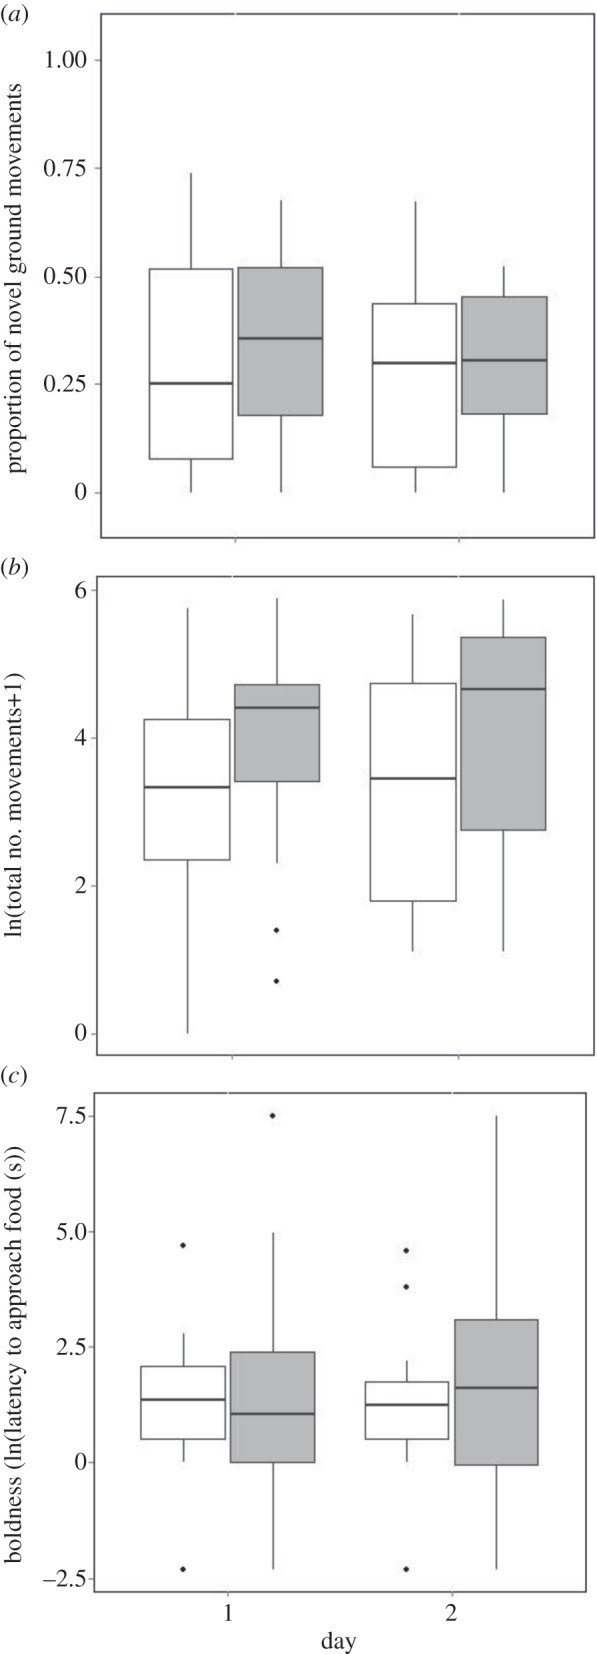
Figure 2.

Median behaviour at the end trials (days 1 and 2) for control (white) and FLUOX birds (grey): (a) individual exploration (proportion of total movements that were novel ground movements), (b) individual activity (ln(total number of movements + 1)) and (c) boldness (ln(latency to approach food (s)). Boxes represent the upper and lower quartiles and points beyond the ends of the whiskers represent outliers as defined by Tukey [58].
