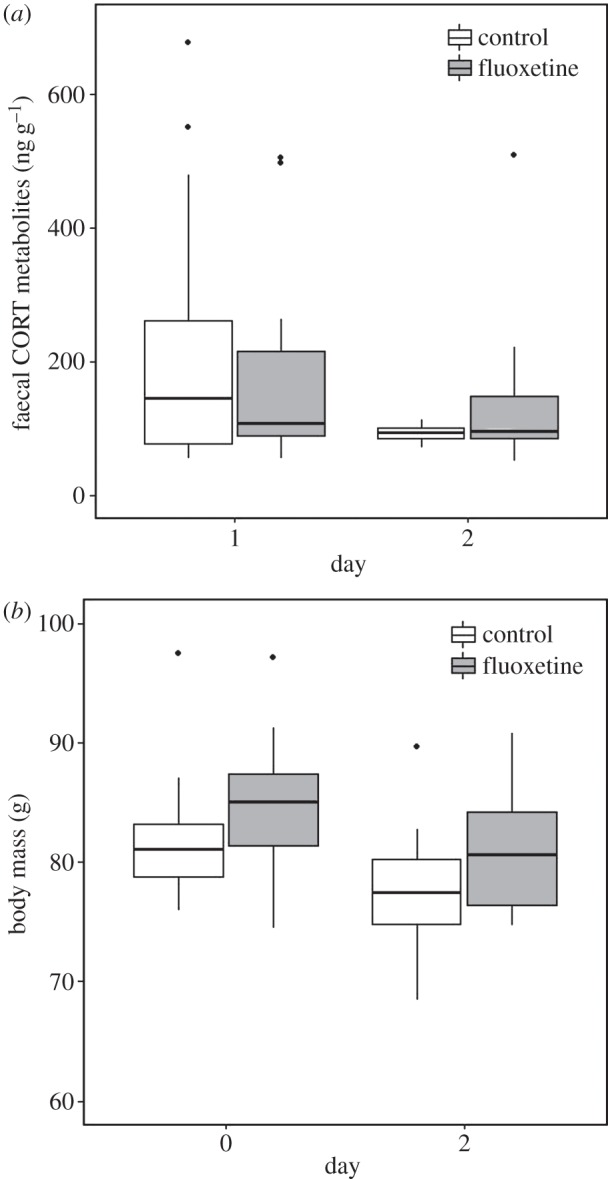
Figure 3.

(a) Median faecal CORT metabolite concentration (ng/g of dry faeces) on days 1 and 2 for the end trials and (b) median body mass (g) on day 0 (the afternoon before the day 1 trials) and day 2 for end trials for control birds (white) and FLUOX birds (grey). Boxes represent the upper and lower quartiles and points beyond the ends of the whiskers represent outliers as defined by Tukey [58].
