Figure 3.
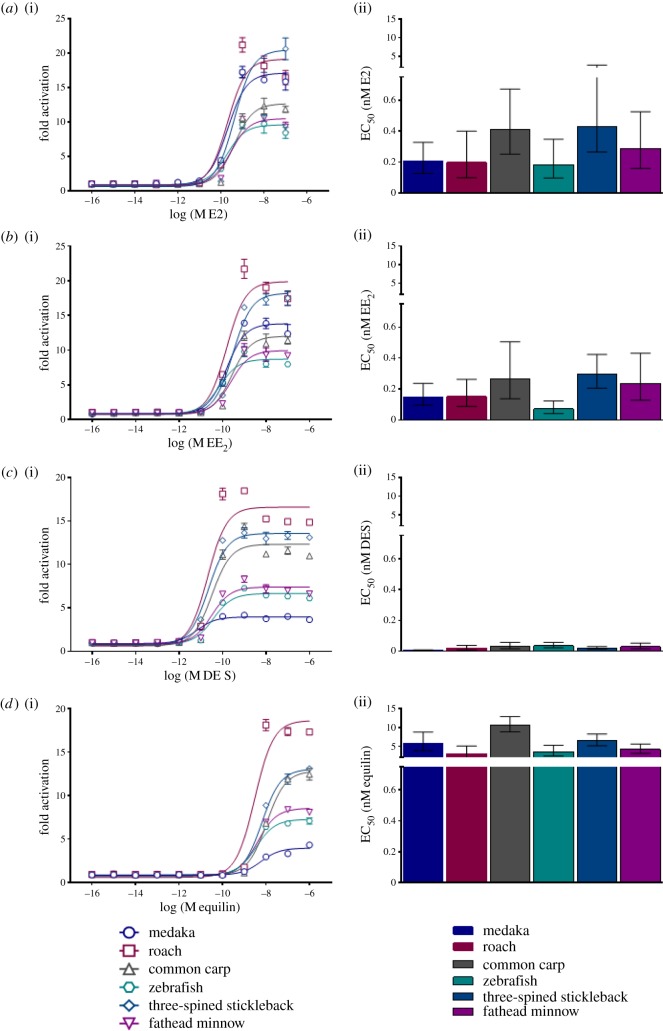
Fish oestrogen receptor (ESR1) responses in transactivation assays induced by oestrogenic pharmaceuticals. (a) 17β-Oestradiol (E2), (b) 17α-ethinyloestradiol (EE2), (c) diethylstilboestrol (DES), (d) equilin. Receptor transactivation data are shown in terms of fold-activation (i) and EC50 (ii). Fold-activation represents the difference in receptor activity (non versus pharmaceutical exposure) of ESR1 from six selected fish species transfected into human HEK293 cells [32]. Receptor activity was quantified using a dual luciferase reporter assay. EC50 is the effective concentration (nM) corresponding with 50% of maximum ESR1 transactivation. Data are presented as mean ± s.e.m. from three independent assays, each consisting of three technical replicates per concentration tested. (Online version in colour.)

