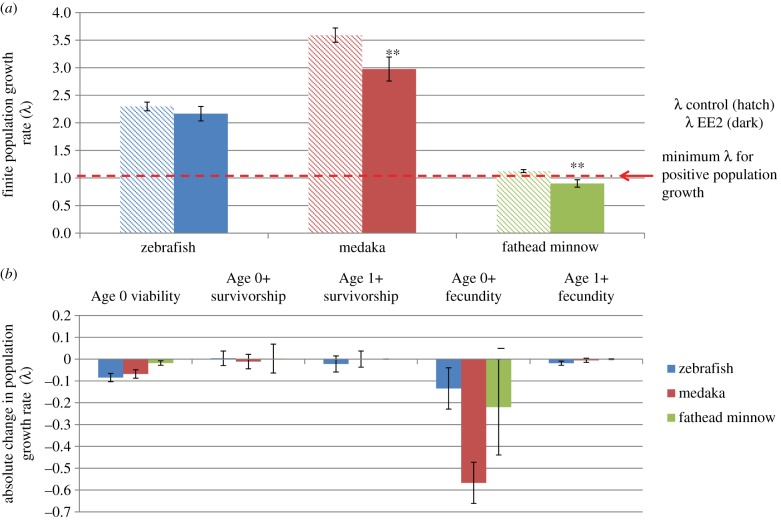
Figure 5.
(a) Mean (s.e.m.) projected finite population growth in model fish species following lifetime exposure (embryo to adult) to 1 ng l−1 ethinyloestradiol (EE2) compared with control populations with no chemical exposure. (b) Contribution of each vital rate to reductions in finite population growth rate. Mean of n = 100 stochastic matrix projections and standard error of the mean (SEM) shown. **p < 0.001 according to the Kruskal–Wallis test comparing ranked projections of finite population growth in EE2 exposed populations versus non-exposed (control) populations of model fish species. (Online version in colour.)

