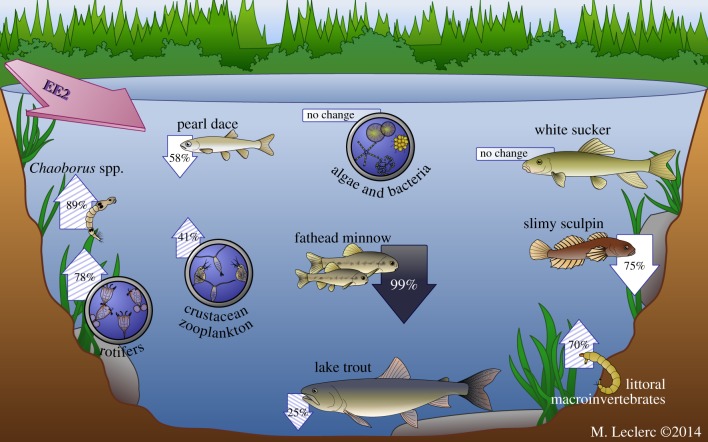
Figure 3.
Schematic of the population responses observed in the Lake 260 food web during and after three summers of EE2 additions. Solid arrows represent direct effects, hatched arrows represent likely indirect effects and white arrows represent potential direct effects. The relative magnitudes of the responses are indicated by percentage changes in abundance or biomass over the following periods: fathead minnow (combined; YOY 1999–2000 to 2002–2005; adults 1999–2000 to 2004–2005); pearl dace (1999–2000 to 2001–2005); slimy sculpin (1999–2000 to 2002–2004); lake trout (1999–2000 to 2003–2005); Chaoborus (1999–2000 to 2002–2004); littoral macroinvertebrates (emergence data 1999–2000 to 2002); crustacean zooplankton (1999–2000 to 2003–2005); rotifers (1999–2000 to 2003–2005). (Online version in colour.)

