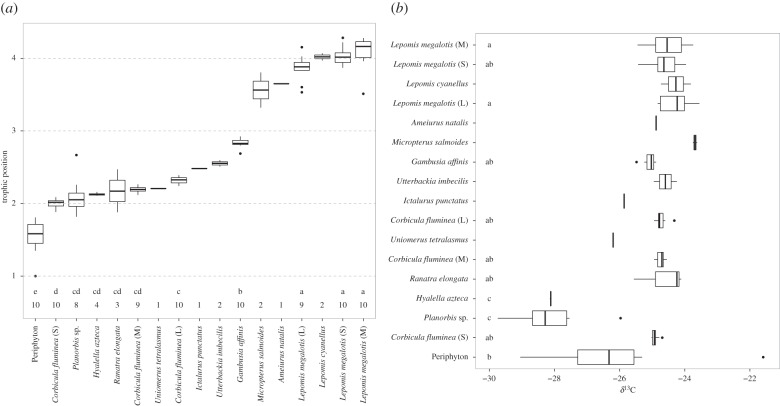
Figure 1.
(a) TP and (b) trophic extent (δ13C) of species from the effluent-dependent North Bosque River, TX, USA. In both panels, boxplots represent median and 25% and 75% quartiles, respectively; whiskers are 95% and dots represent outliers. Grey numbers along the x-axis of panel (a) indicate sample size of the species. Letters along the x-axis of panel (a) or the y-axis of panel (b) represent significantly different groups.

