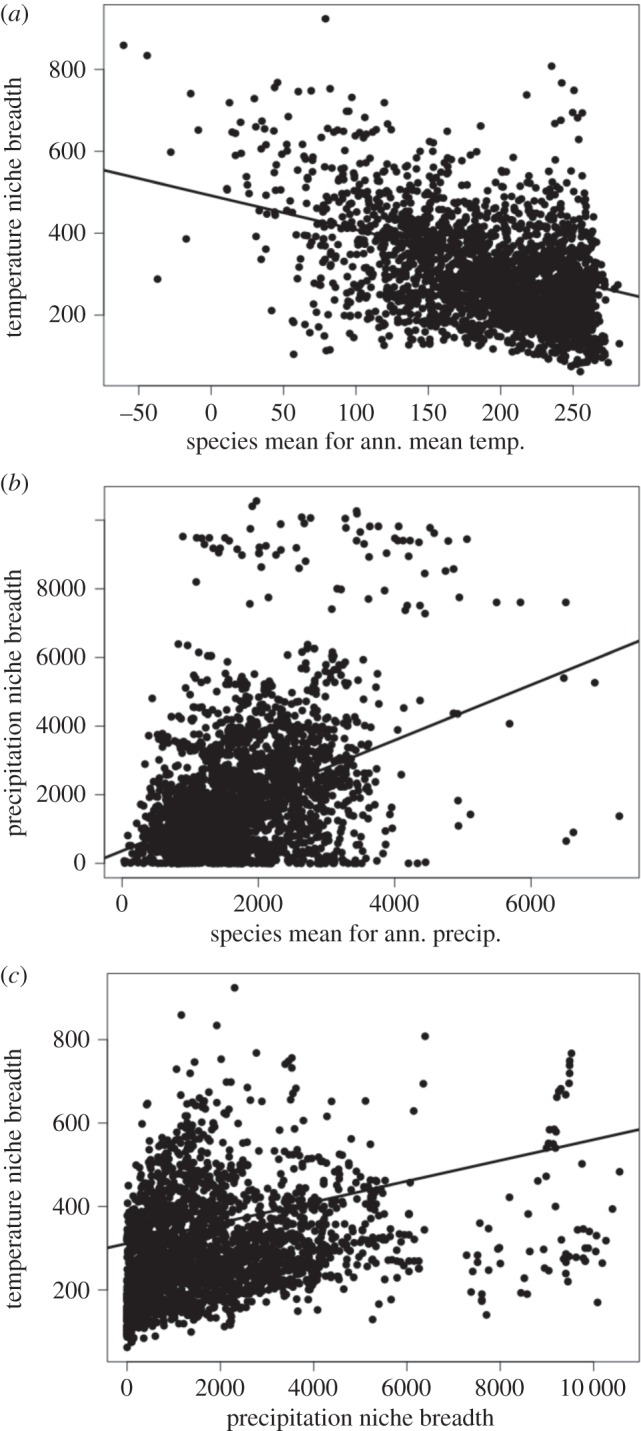
Figure 3.

Results of the major hypotheses tested in this study, shown using the raw data for ease of interpretation. PGLS results are concordant and shown in table 1. Note that temperatures are multiplied by 10. (a) Negative relationship between species' TNB (Bio5−Bio6) and their mean values for annual mean temperature (Bio1). (b) Negative relationship between species' PNB (maximum Bio12−minimum Bio12) and their mean values for annual precipitation (Bio12). (c) Positive relationship between TNB and PNB.
