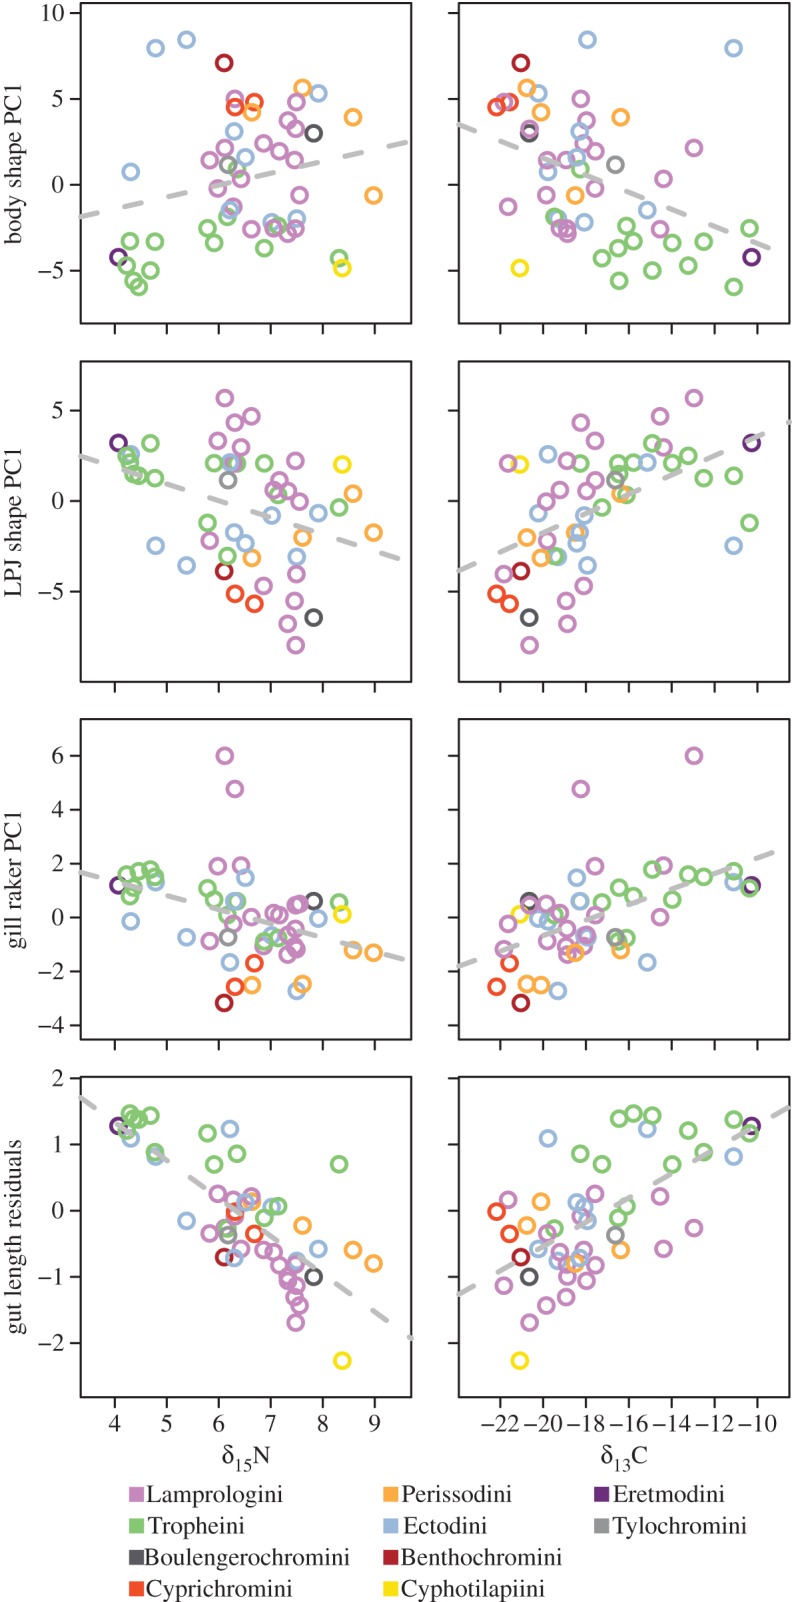
Figure 1.

Phenotype–environment correlations. Species means of trait values (see ‘Material and methods’ for details) were plotted against species means of δ13C and δ15N. δ13C is considered to be an indicator of macrohabitat use, with higher or lower values reflecting a benthic or limnetic carbon source, respectively. δ15N is a proxy for trophic level, with larger values reflecting a higher trophic position.
