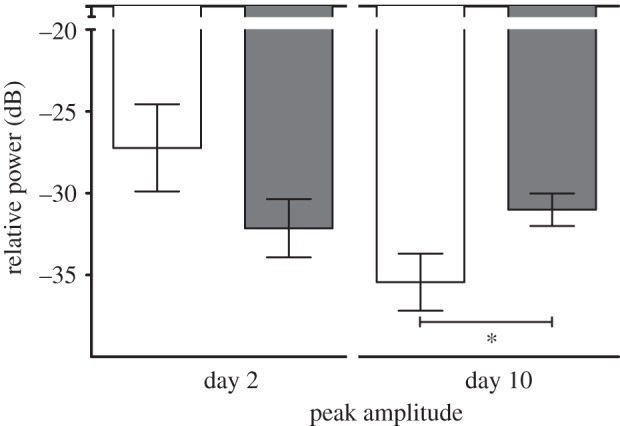
Figure 2.

Shown is the relative power (dB) of the mean peak max amplitude of male USV at day 2 and 10 in WT (N = 6 animals; white bars) and Period1-deficient (Per1−/−; N = 16 animals; grey bars) mice. The peak amplitude was not different in Per1−/− mice compared with WT mice at day 2. By contrast, the mean peak amplitude was significantly higher at day 10 in Per1−/− mice compared with WT mice. Genotype comparison was done by t-test (*p ≤ 0.05). All values are given as mean ± s.e.m.
