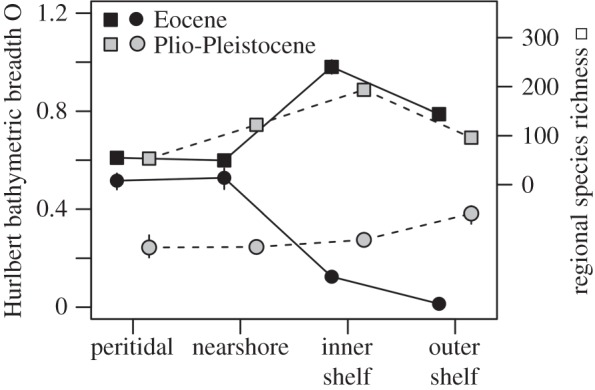
Figure 3.

Hurlbert bathymetric breadth of Eocene species (black circles) on average declines towards offshore, whereas Hurlbert breadth of Plio-Pleistocene species (grey circles) changes weakly. Hurlbert breadth of offshore species is significantly higher in the Plio-Pleistocene than in the Eocene. Species richness (rarefied to 2477 individuals per habitat) increases towards inner shelf at both time intervals and this increase is less steep during the Plio-Pleistocene (grey squares) than during the Eocene (black squares).
