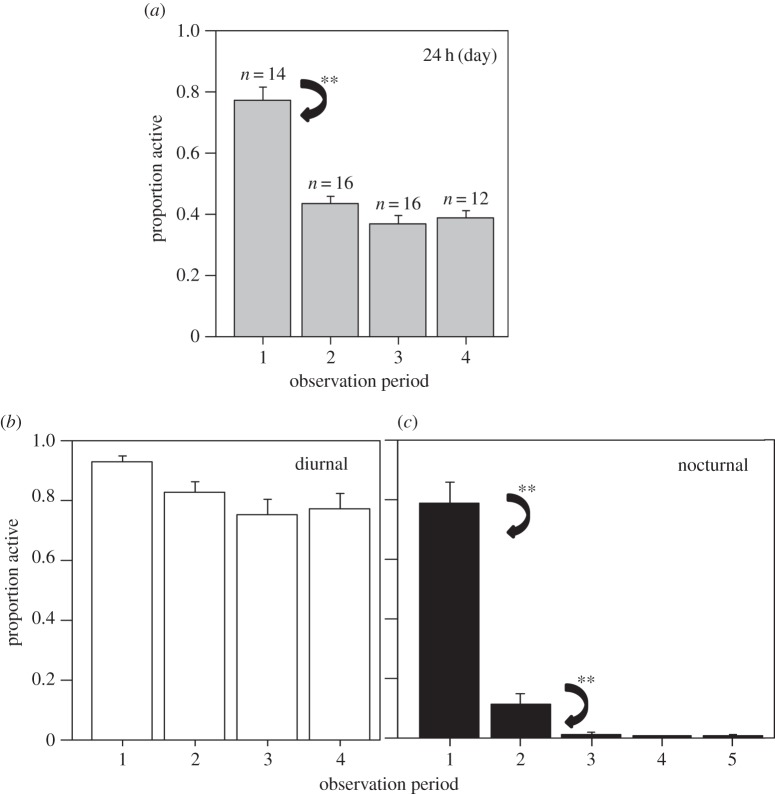
Figure 4.
Mean proportion of time spent swimming during each 24 h (daily) observation period (a) and each diurnal (b) and nocturnal (c) observation period where data were available for at least 12 hatchlings. Standard error bars are also plotted. Arrows indicate where swimming activity levels significantly differed between subsequent time periods at the p < 0.0001 level (**). Swimming activity dropped significantly after the first 24 h period due to the significant decline in nocturnal swimming activity after the first night and virtual nocturnal inactivity of hatchlings by the third night. Subsequent activity level patterns remained consistent for turtles kept up to 7 days with virtual nocturnal inactivity and the proportion of each diurnal period spent swimming remaining between 0.8 and 0.9.

