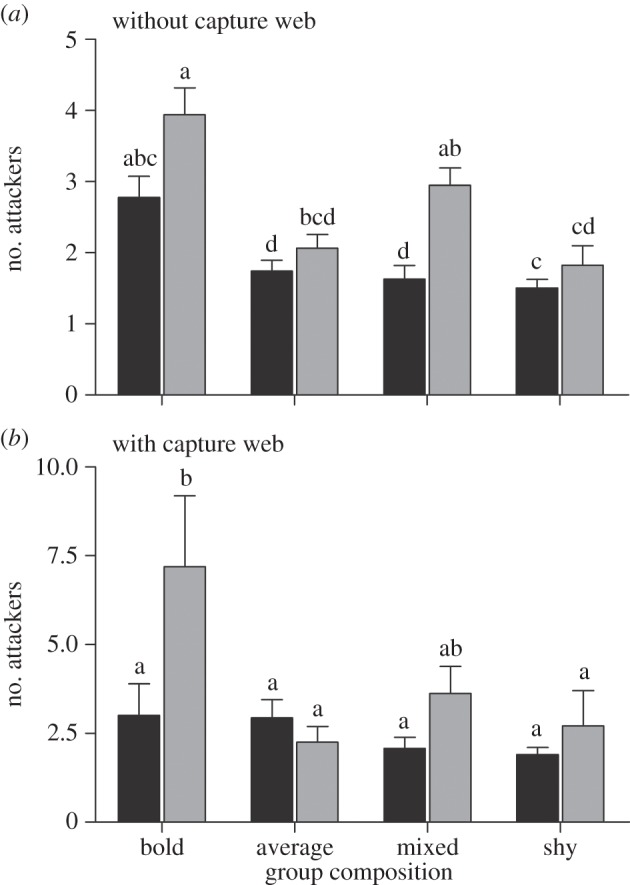
Figure 3.

(a,b) The number of individuals that participated in the attack was influenced both by the composition of the group and the group size (F3,256.1 = 5.12, p = 0.002). For example, groups of 30 (grey bars) bold spiders always had more individuals participate in the attack compared with groups of 10 (black bars) (F1,257.5 = 26.25, p < 0.0001). Values significantly different from each other are represented by different letters within each panel.
