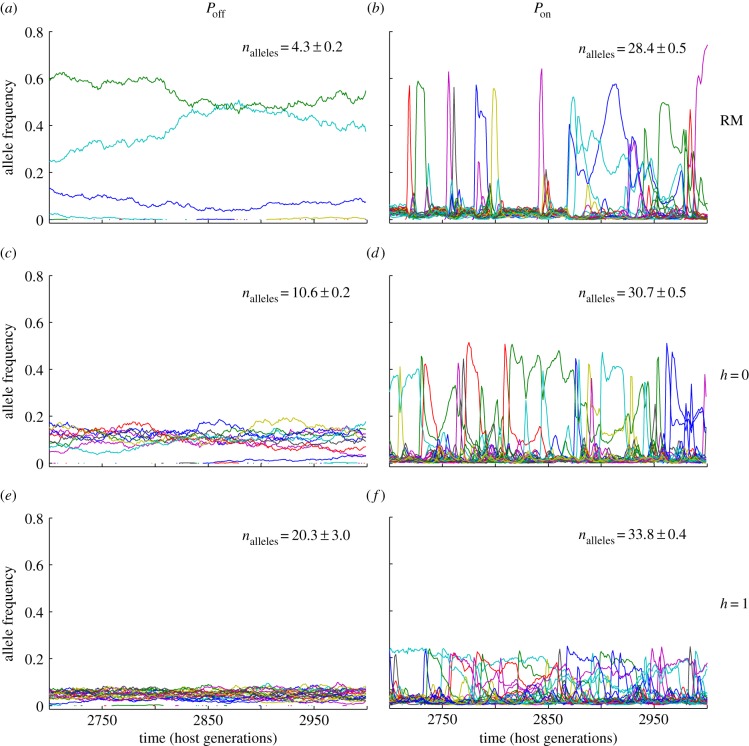
Figure 3.
(a–f) Natural and sexual selection generate distinctive signatures on the allele frequency spectrum. Allele frequency variation under six scenarios of natural (Pon, Poff) and sexual selection (RM, h = 0, h = 1), for a host population of Ne = 5000 individuals. The pathogen mutation rate for all simulations was set to 2 × 10⁻³ per antigen per generation.

