Figure 2.

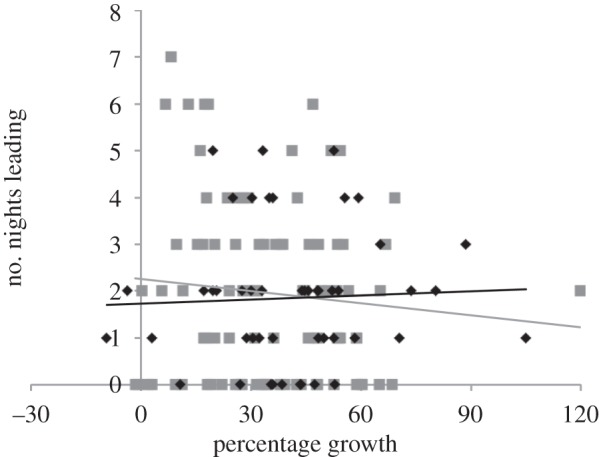
The percentage growth of larvae within the control groups by the number of nights they led during the first (black diamonds, n = 49) and the second (grey squares, n = 90) monitoring periods.

The percentage growth of larvae within the control groups by the number of nights they led during the first (black diamonds, n = 49) and the second (grey squares, n = 90) monitoring periods.