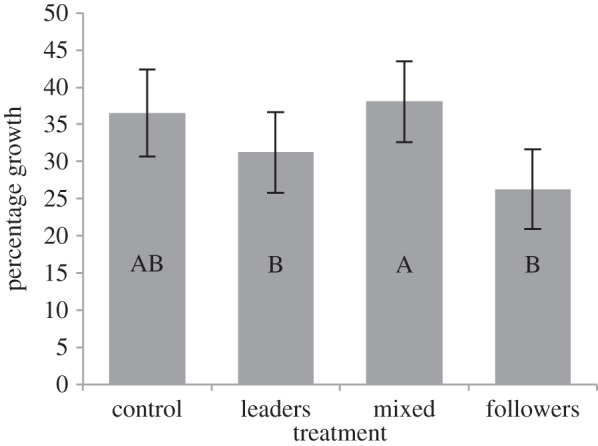
Figure 4.

The percentage growth of the four different treatment groups over the second monitoring period (14 days). Data presented are the least-square means ± s.e. from the general linear-mixed model. Columns not displaying the same letter are significantly different. From left to right, n = 90, n = 93, n = 78, n = 119 for each treatment.
